This is second part of our VR data post. Here is the first part.
We are still looking for new ways to visualise and work with data in VR. Small or big. We believe we are on to something with VR, but we can’t verbalise it yet.
So far, even the most complex data are restrained to 2D charts, or 3D visualisations on your screen. VR space provides much bigger scale, and new dimension. But where to start?
Let’s say we have price chart of Bitcoin. We have information like time scale, highest price, lowest price, open and close price, during given time period.
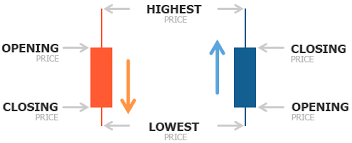
How can we put this piece of information to VR space to be more easily understood by human observer? How can we utilise the added space and dimensions so it is not too overwhelming for human brain? Can we add more information to one data object, using 3rd and 4th dimension?
We have to remember: data are only as useful, as the impact they have on our decisions. So there is no need for irrelevant data pukes (term coined by Avinash Kaushik ).
Here are two examples of inspirative data visualisations in VR:
Common “real world” data tools in VR by Nirvaniq Labs:
Data clusters crunched by Machine Learning algos by Project NEO:
VR space and it’s possibilities are still mostly terra nova – lots of unknown opportunities, but also dead-ends. We embark on a mission to discover this New World. And data visualisations are on the front lines.
Do you have an idea, how to put data into VR?